



Only the rows you need
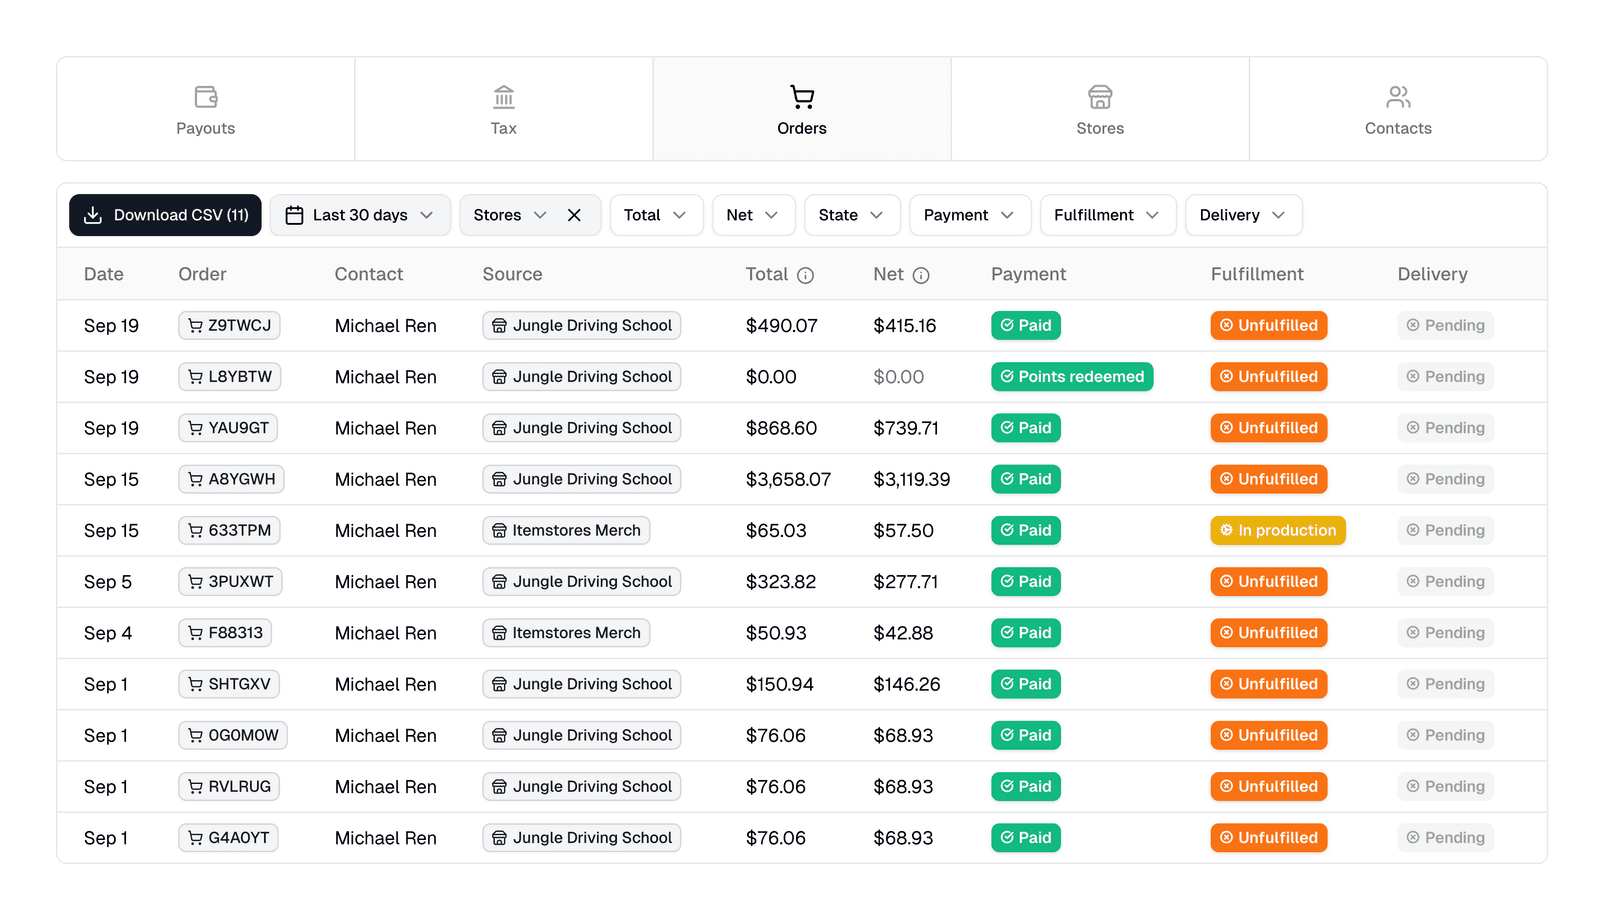
Filter a report before you export it. Your bookkeeper gets the rows they asked for and nothing to clean up.
See which stores are growing and which have slowed since last period. You spot the slow ones while there's still time to promote them.
$0/mo
Free forever

Know whether last month was a good one before you plan the next.
We chart sales and store traffic against the period before. Spot a slow week before it turns into a slow season.
We break down the discounts, taxes and fees between gross sales and what you keep. A thin month always has an explanation.
Know which customers are worth a call about next season's store.
Put the products that earn the most at the front of your next store.

Filter a report before you export it. Your bookkeeper gets the rows they asked for and nothing to clean up.
Hand payouts to your bookkeeper and tax totals to your accountant without building anything by hand.
The past day, 7 days, 30 days, 3 months, 6 months, 12 months, or all time. All time starts when your business was created, going back at most five years.
No. Revenue is the total charged minus the tax collected, and net is revenue after fees, refunds and chargebacks. Total and taxes are shown on their own lines in the sales breakdown.
Yes. Reports has orders, stores, contacts, tax and payouts reports. Filter one, then download it as a CSV to get every row that matches.
Yes. Stores by revenue charts your five highest-earning stores for the range, and top products ranks products by units sold, with the revenue from each.
Yes. Each store's page has its own visitors, orders and revenue, and the analytics page adds them up across every store with conversion rate on top.
No subscriptions. No website hosting fees. Share your link and start selling today.