
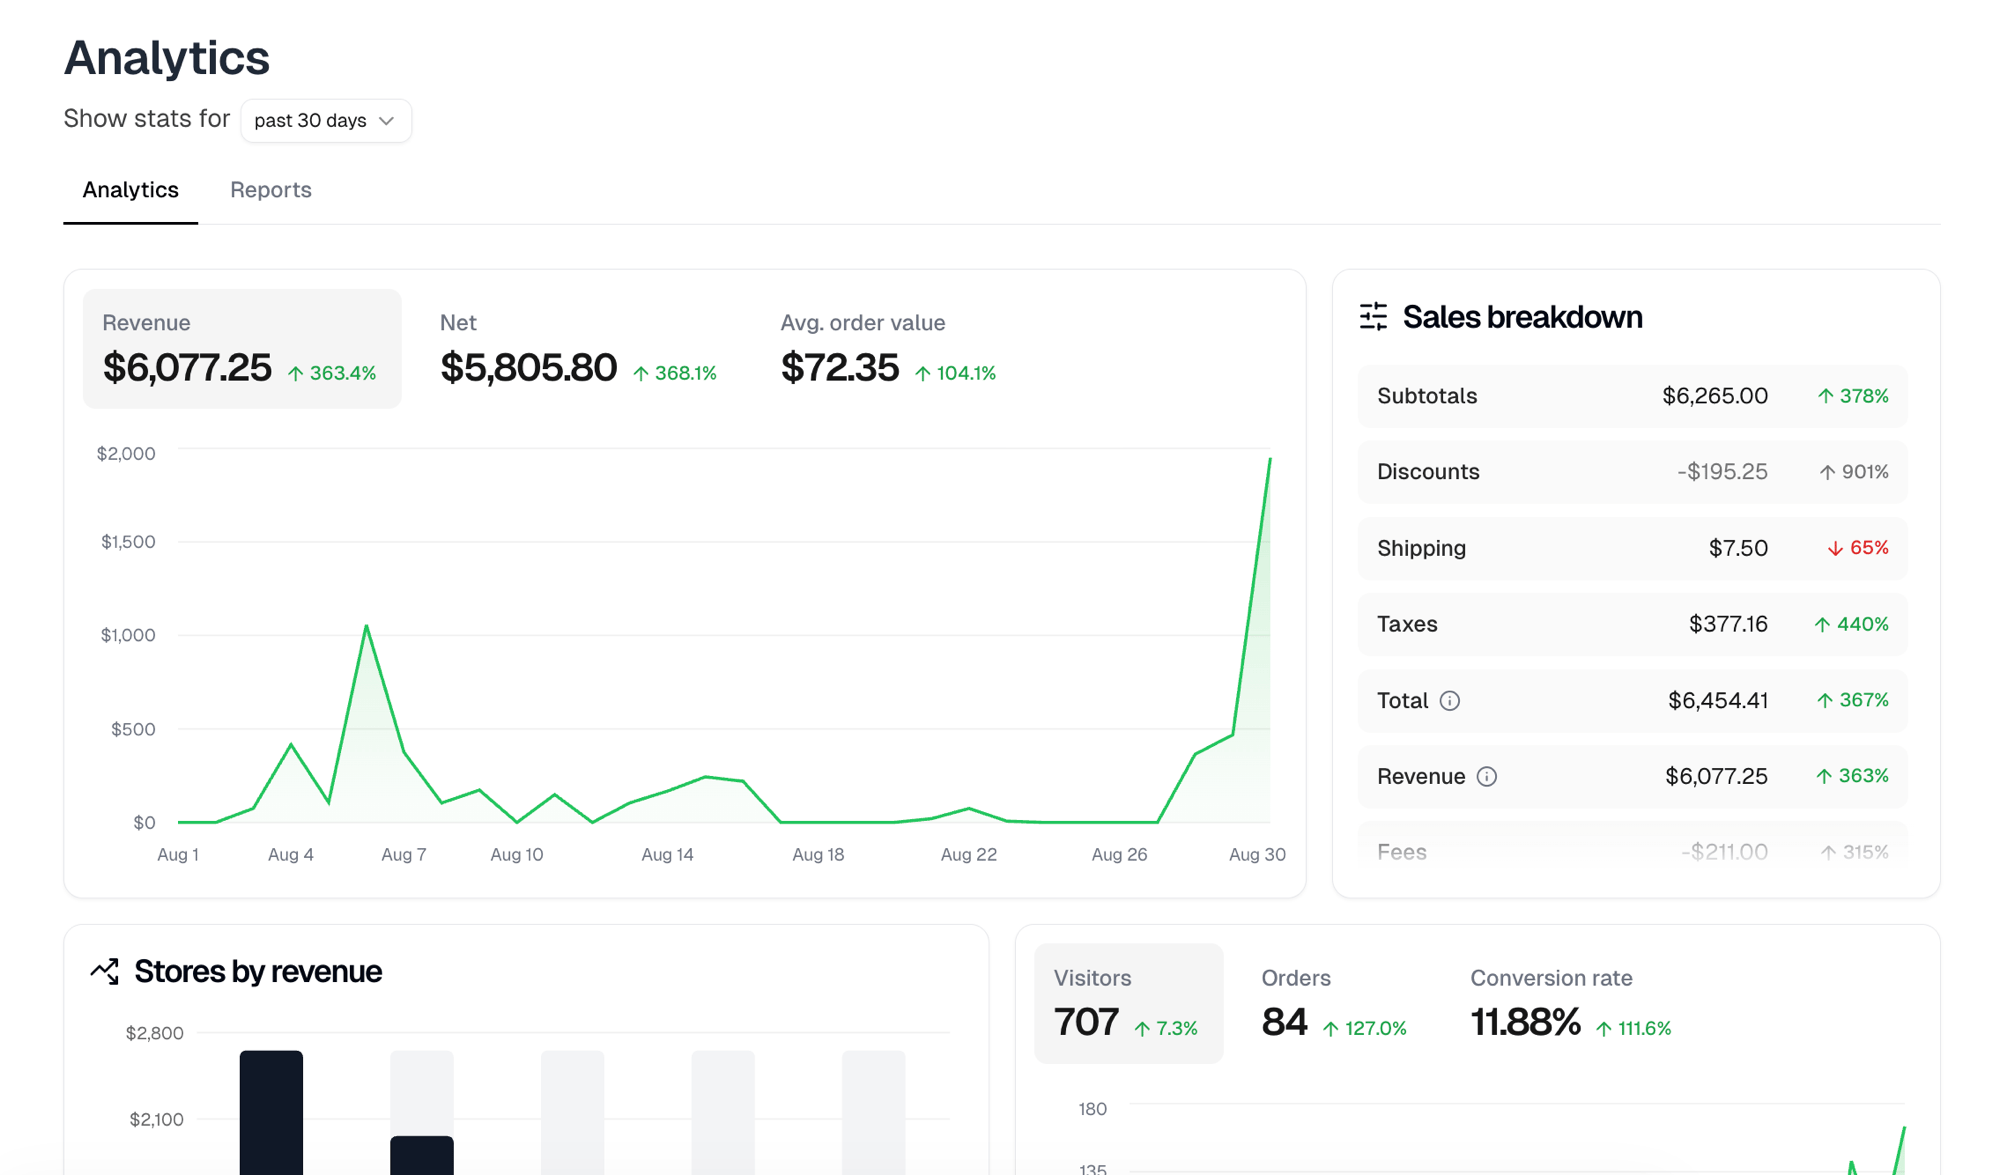
Revenue
Revenue, Net and Avg. order value, each with its change against the previous window. Select one to chart it.Sales breakdown
Where the money went: Subtotals, Discounts, Shipping, Taxes, Total, Revenue, Fees, Charged back, Refunded and Net. A Disputed row joins them while a dispute is open. The deduction rows are hidden when they are zero, so a window with no discounts, fees, chargebacks or refunds shows a shorter list. Total, Revenue and Net each carry an info icon explaining how that figure is derived, since they are not the same number.Stores by revenue
Your five highest-earning stores in the window, as a bar chart. This is where to look when you want one store’s performance rather than the whole business.Visitors, orders and conversion
Visitors, Orders and Conversion rate, charted the same way as revenue.Order efficiency
Counts of Incomplete, Unfulfilled, Pending delivery and Completed orders, plus two averages. Only Completed is limited to the window. The other three count every order sitting in that state right now.
Each says how many orders it is based on, so you can judge whether the average
means anything yet.