> ## Documentation Index
> Fetch the complete documentation index at: https://itemstores.com/help/llms.txt
> Use this file to discover all available pages before exploring further.
# Analytics
> Sales performance across stores and time ranges
**Show stats for** at the top sets the window every card on the page uses: past
day, past 7 days, past 30 days, past 3 months, past 6 months, past 12 months, or
all time.
"All time" runs from the day your business was created, or five years ago,
whichever is later.
 ## Revenue
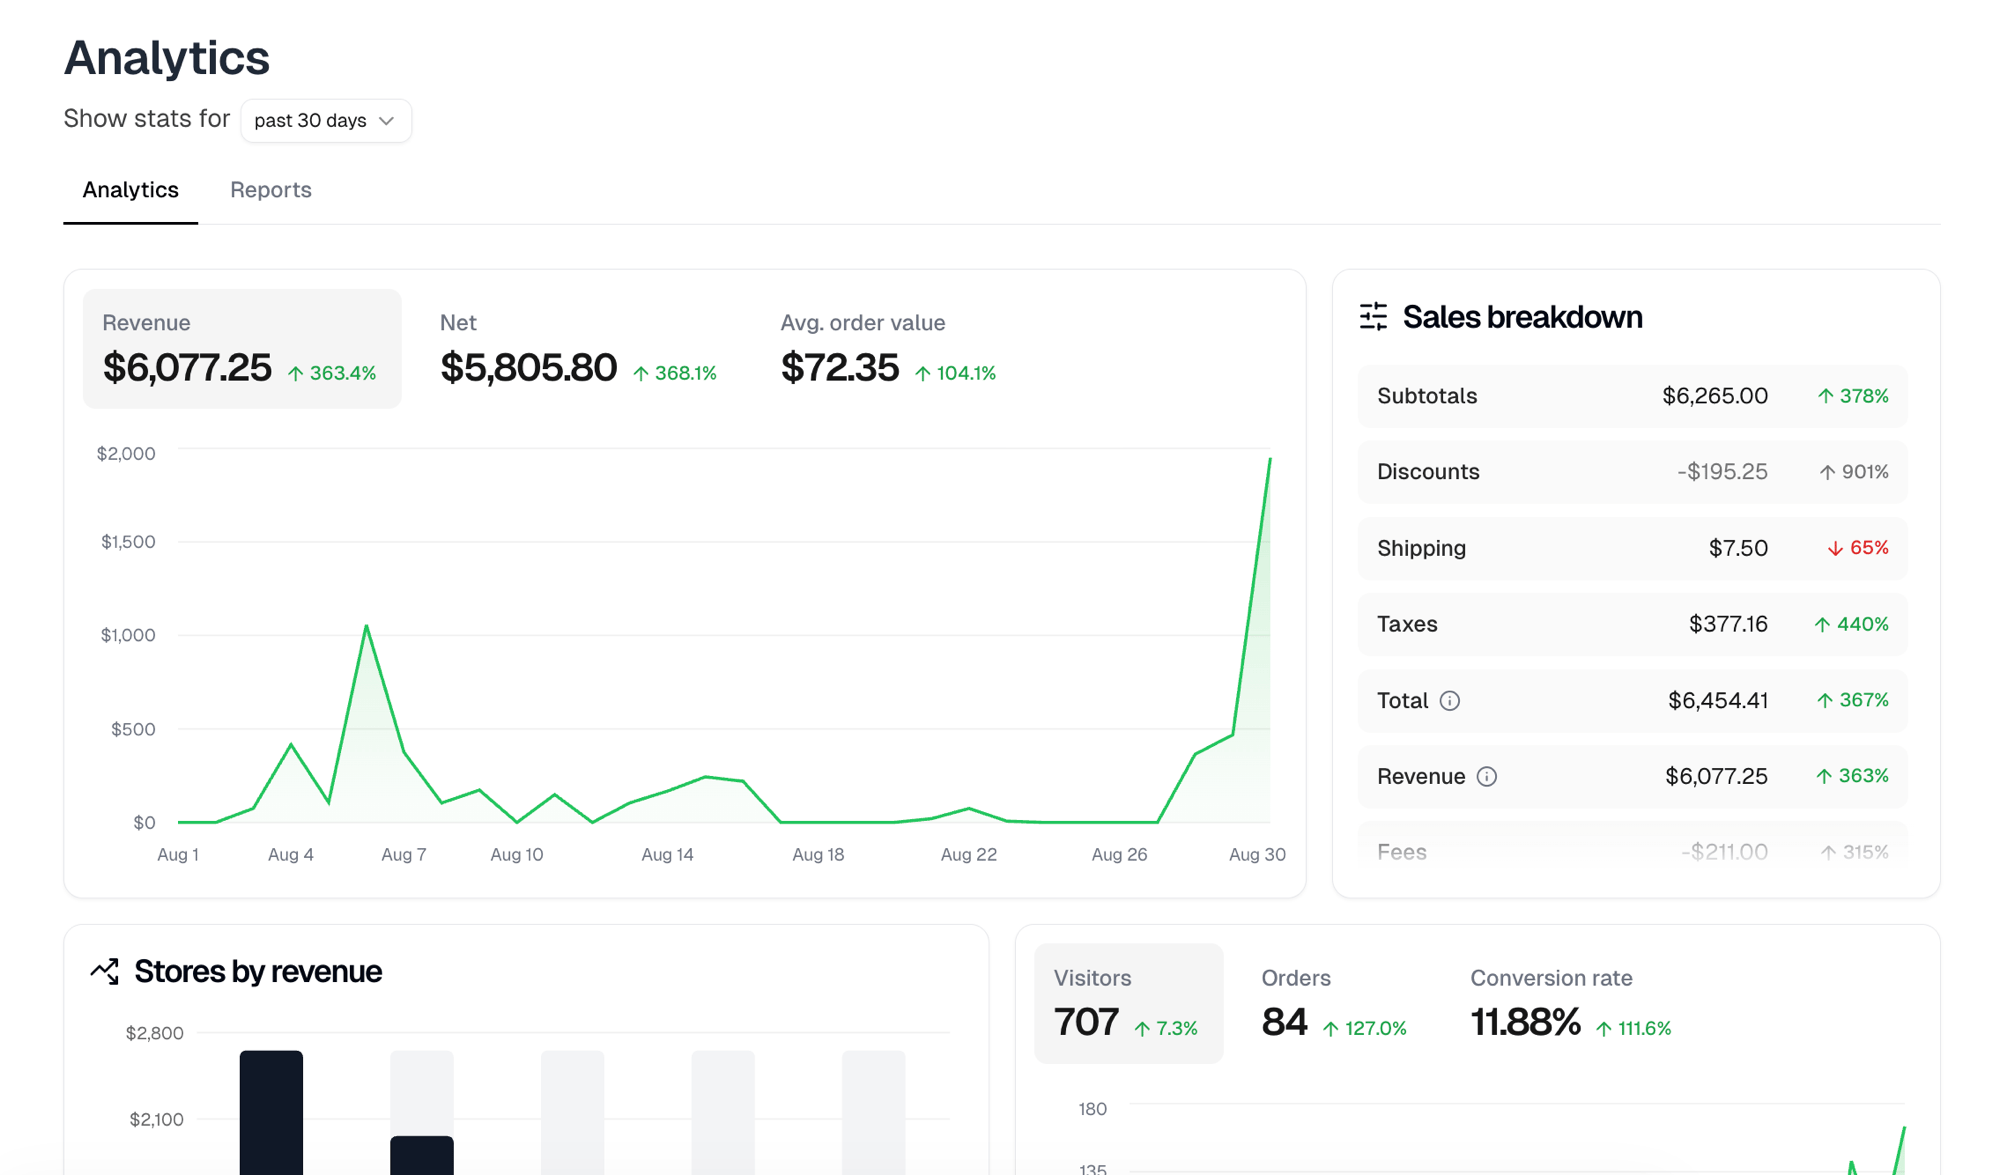
**Revenue**, **Net** and **Avg. order value**, each with its change against the
previous window. Select one to chart it.
## Sales breakdown
Where the money went: **Subtotals**, **Discounts**, **Shipping**, **Taxes**,
**Total**, **Revenue**, **Fees**, **Charged back**, **Refunded** and **Net**. A
**Disputed** row joins them while a dispute is open.
The deduction rows are hidden when they are zero, so a window with no discounts,
fees, chargebacks or refunds shows a shorter list.
Total, Revenue and Net each carry an info icon explaining how that figure is
derived, since they are not the same number.
## Stores by revenue
Your five highest-earning stores in the window, as a bar chart. This is where to
look when you want one store's performance rather than the whole business.
## Visitors, orders and conversion
**Visitors**, **Orders** and **Conversion rate**, charted the same way as
revenue.
## Order efficiency
Counts of **Incomplete**, **Unfulfilled**, **Pending delivery** and
**Completed** orders, plus two averages. Only Completed is limited to the
window. The other three count every order sitting in that state right now.
| Metric | Measured from |
| ------------------------ | --------------------------------------- |
| Average time to fulfill | Orders marked as ready |
| Average time to complete | Orders marked as delivered or picked up |
Each says how many orders it is based on, so you can judge whether the average
means anything yet.
## Top products
Your five best sellers by units sold, with revenue for each. Use this to see how
many of an item sold.
## Revenue
**Revenue**, **Net** and **Avg. order value**, each with its change against the
previous window. Select one to chart it.
## Sales breakdown
Where the money went: **Subtotals**, **Discounts**, **Shipping**, **Taxes**,
**Total**, **Revenue**, **Fees**, **Charged back**, **Refunded** and **Net**. A
**Disputed** row joins them while a dispute is open.
The deduction rows are hidden when they are zero, so a window with no discounts,
fees, chargebacks or refunds shows a shorter list.
Total, Revenue and Net each carry an info icon explaining how that figure is
derived, since they are not the same number.
## Stores by revenue
Your five highest-earning stores in the window, as a bar chart. This is where to
look when you want one store's performance rather than the whole business.
## Visitors, orders and conversion
**Visitors**, **Orders** and **Conversion rate**, charted the same way as
revenue.
## Order efficiency
Counts of **Incomplete**, **Unfulfilled**, **Pending delivery** and
**Completed** orders, plus two averages. Only Completed is limited to the
window. The other three count every order sitting in that state right now.
| Metric | Measured from |
| ------------------------ | --------------------------------------- |
| Average time to fulfill | Orders marked as ready |
| Average time to complete | Orders marked as delivered or picked up |
Each says how many orders it is based on, so you can judge whether the average
means anything yet.
## Top products
Your five best sellers by units sold, with revenue for each. Use this to see how
many of an item sold.